Overview💡
As a graphic designer intern at SOUR, I played a crucial role in supporting various social media campaigns, infographics, and podcast video visualizations.
Wanna see the final product? Check out here 👉🏾 https://www.instagram.com/p/CiqEbAmDyUV/?img_index=1
Problem
Team: Adesewa Adekoya - Graphic Design Intern & Illustrator
Irem Gocmenoglu - Graphic Designer
Marianne de Zeeuw - Project Manager
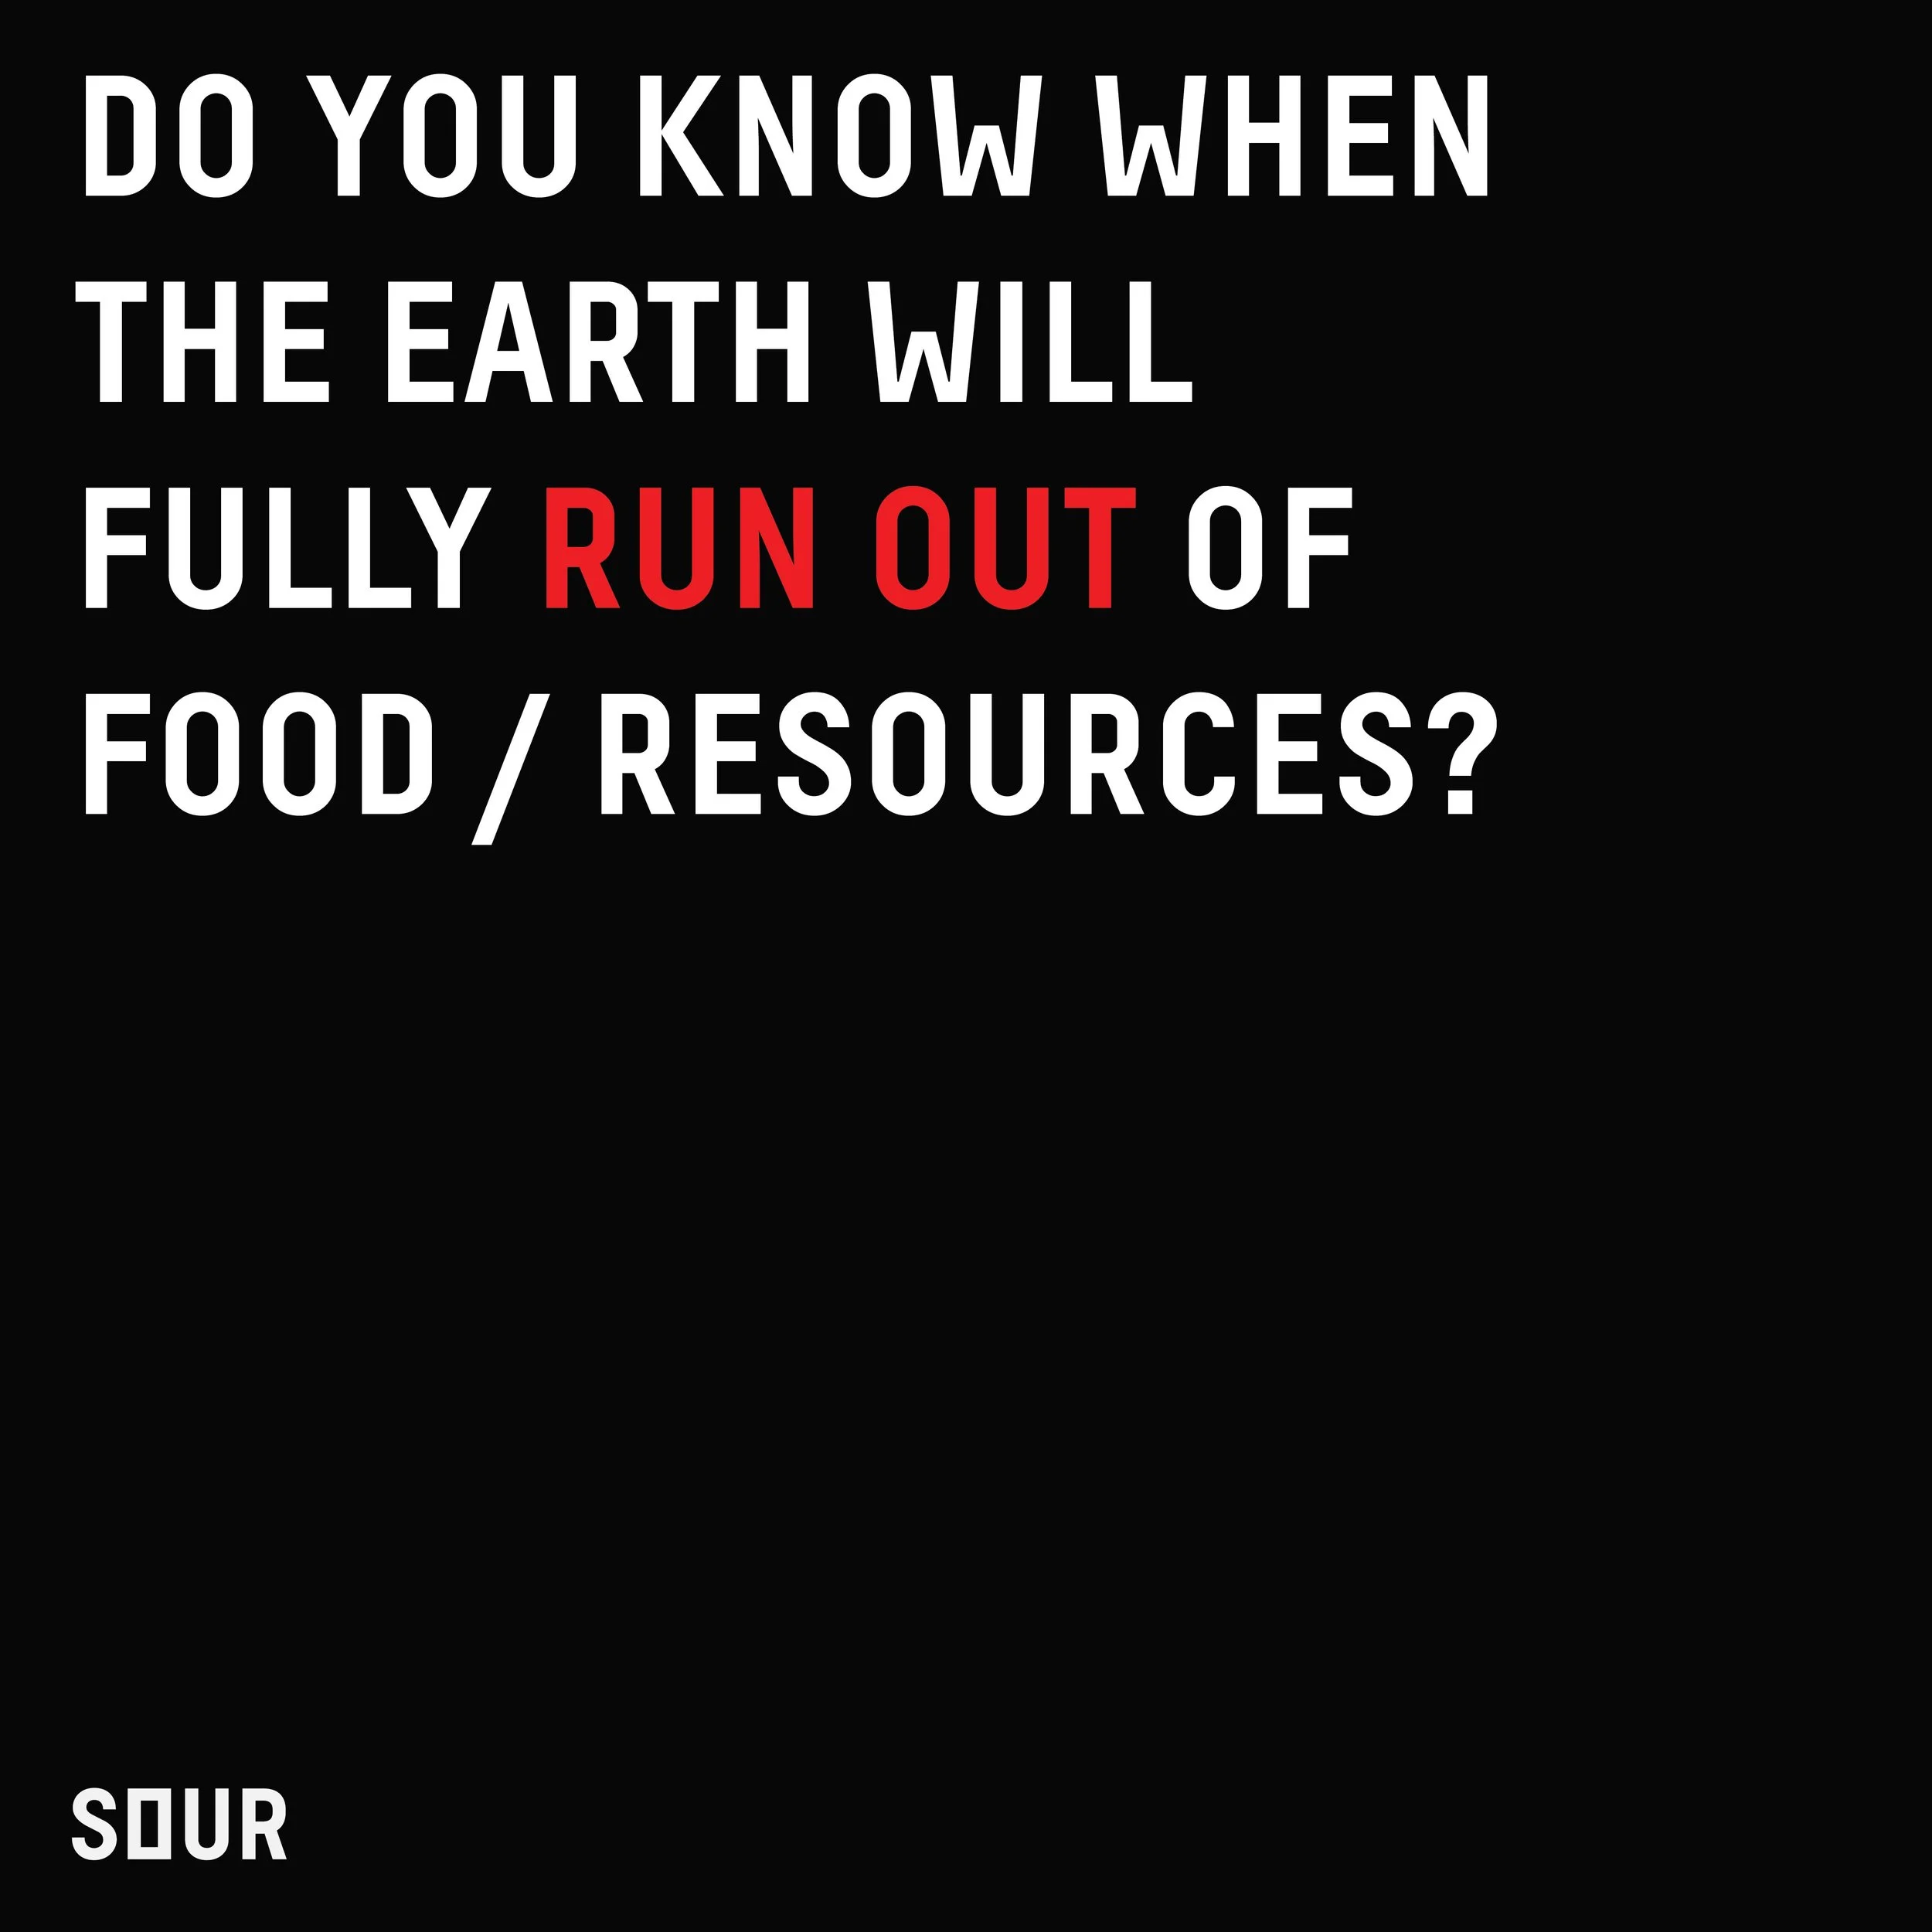
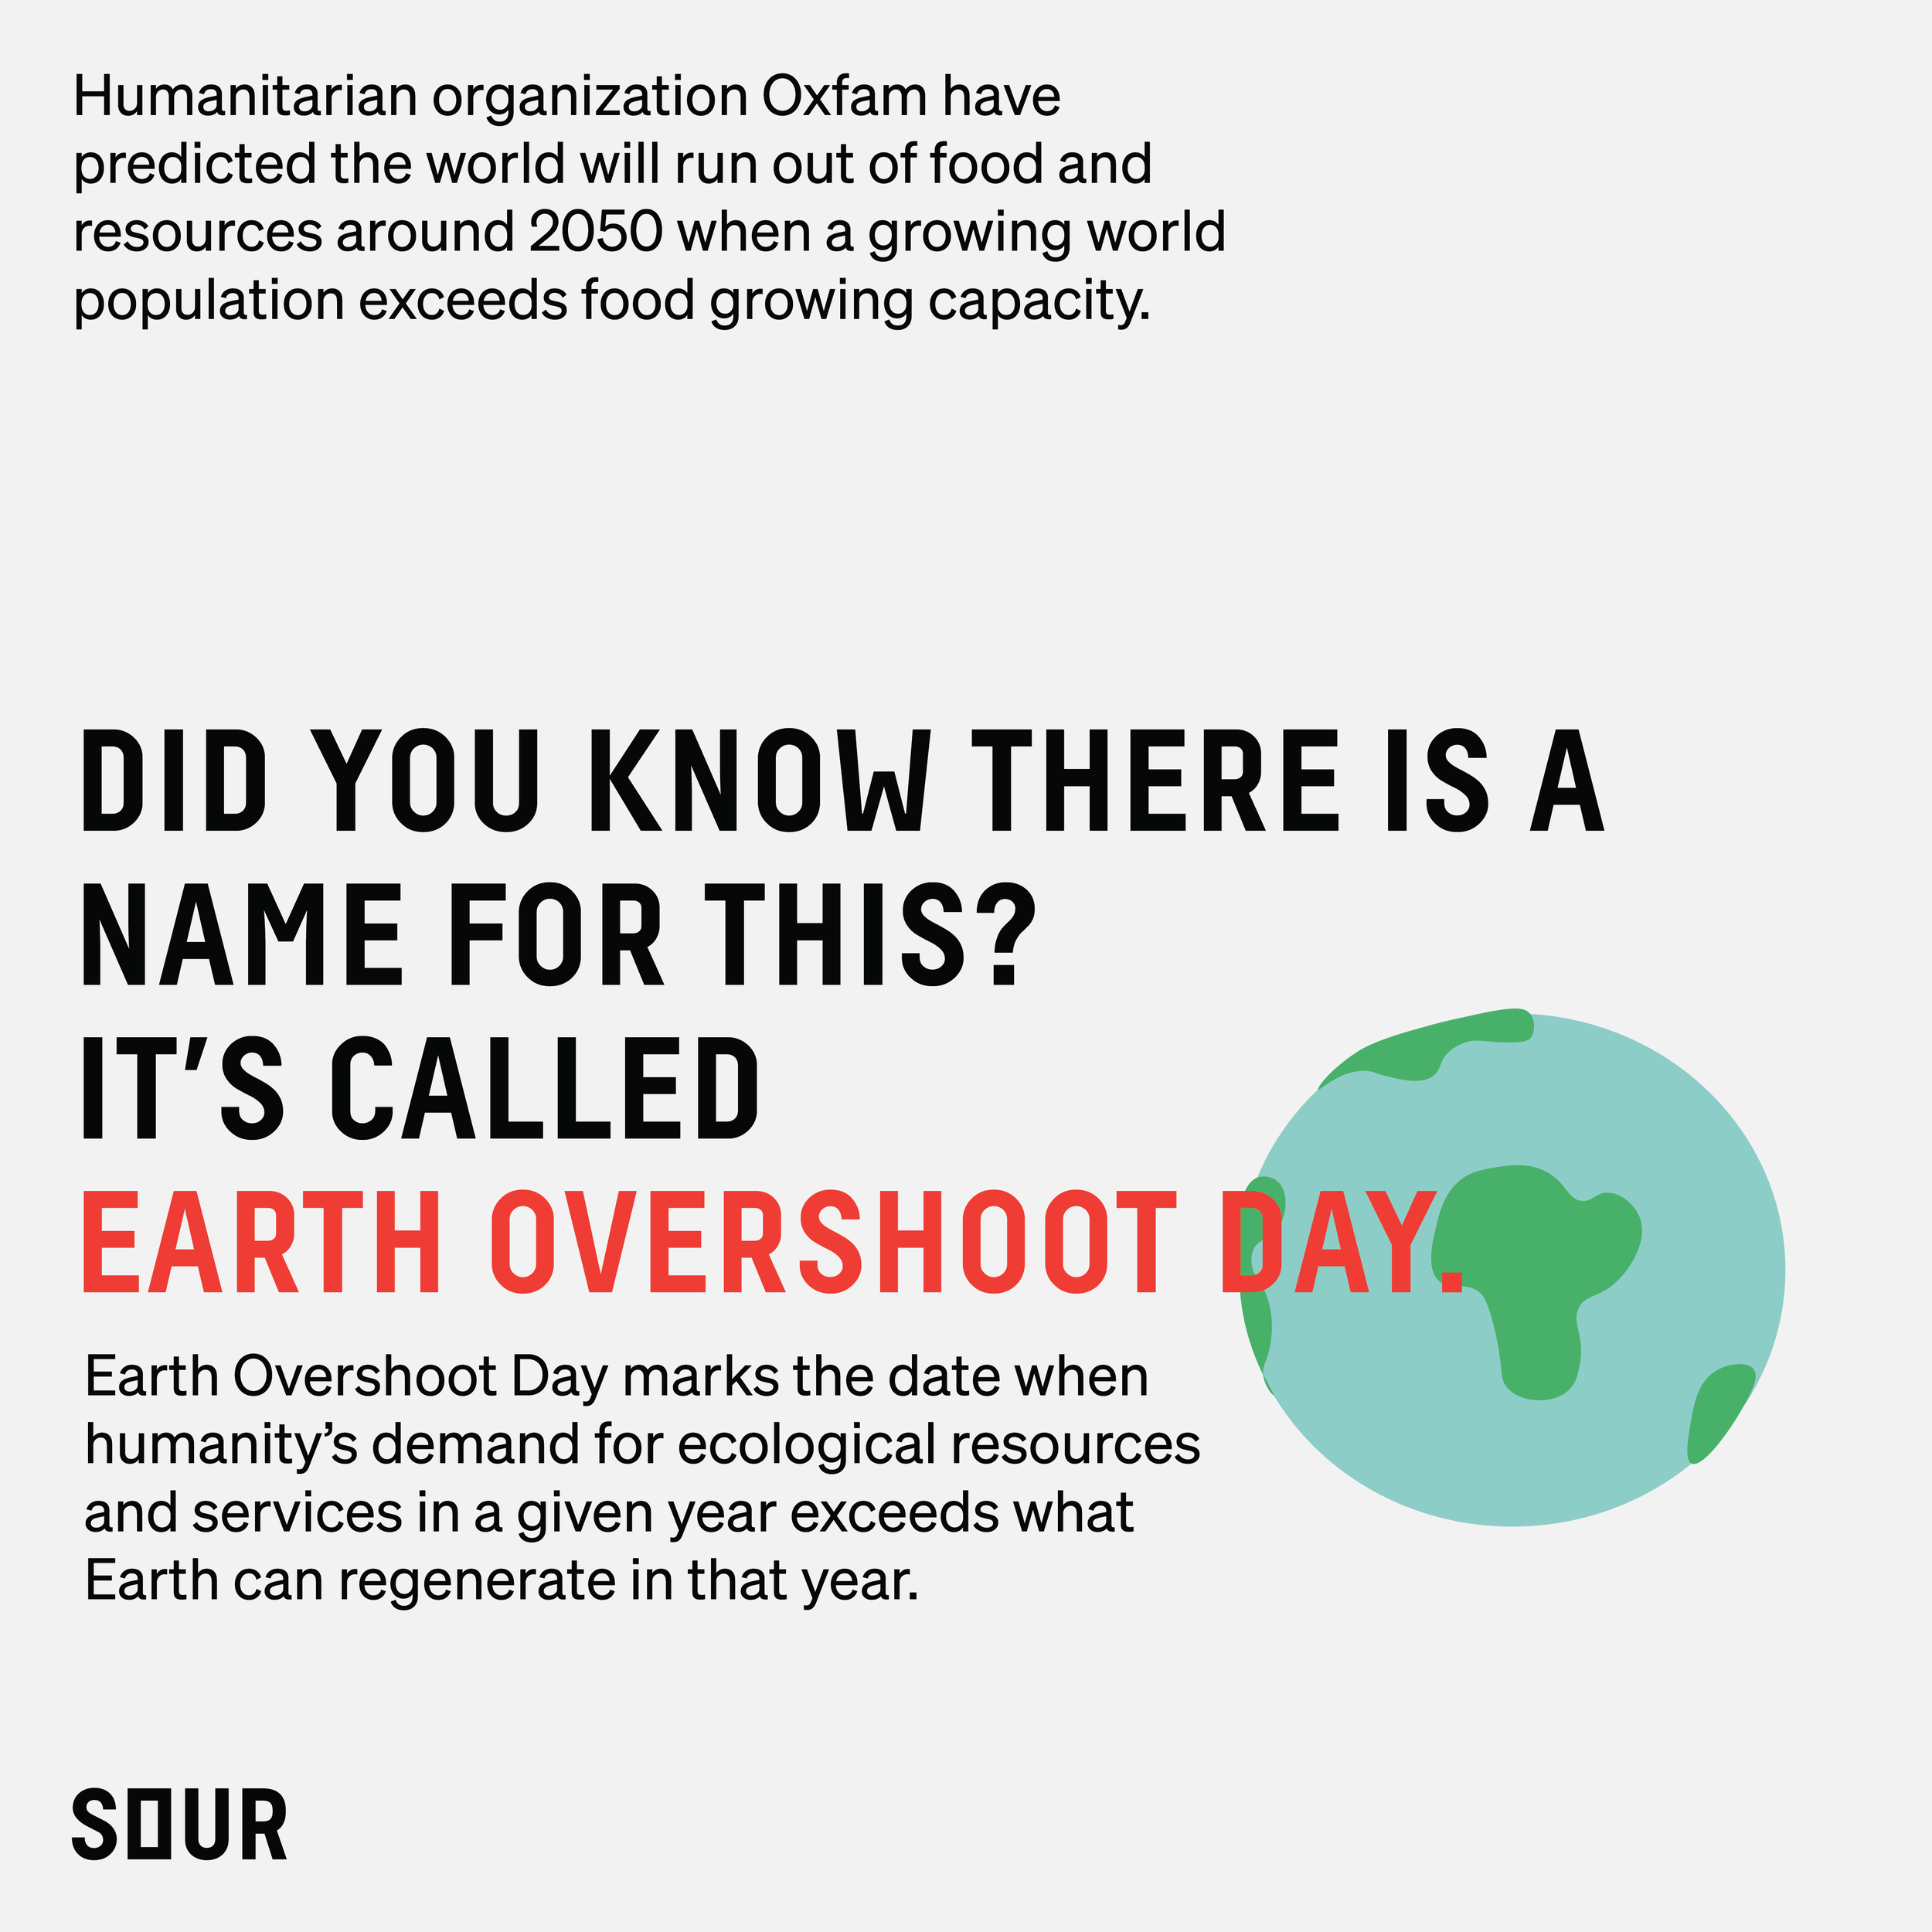
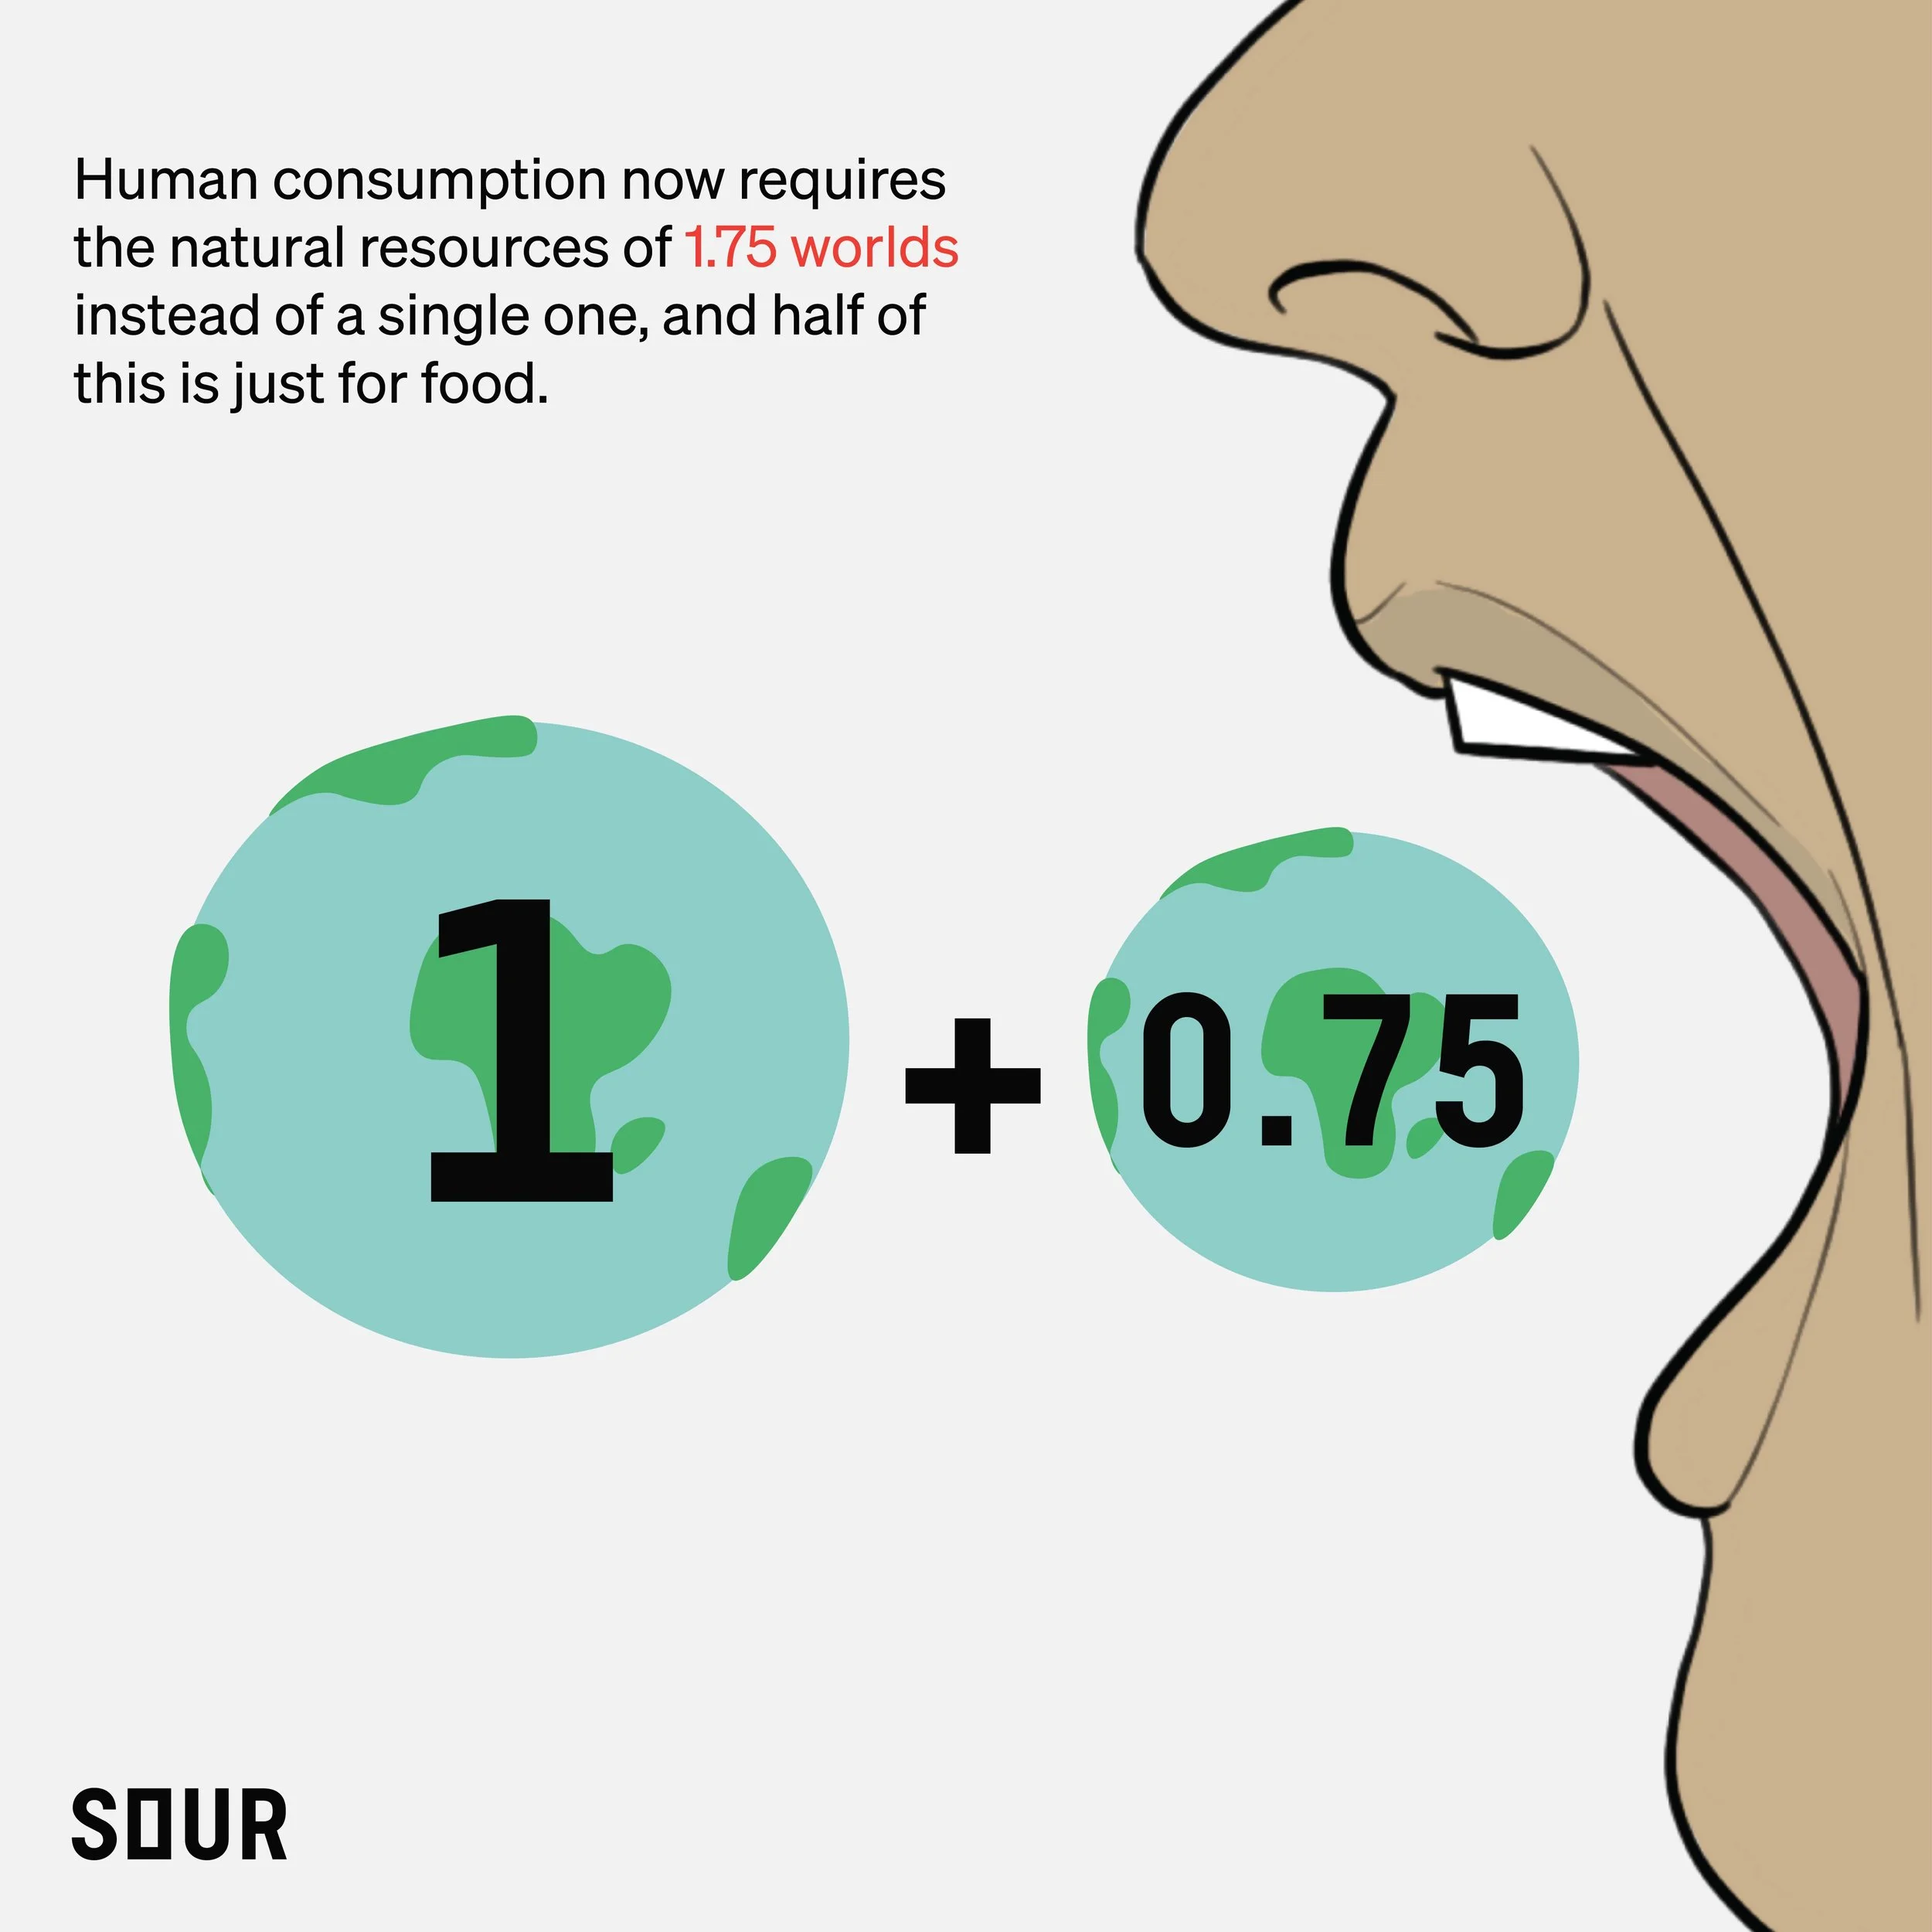
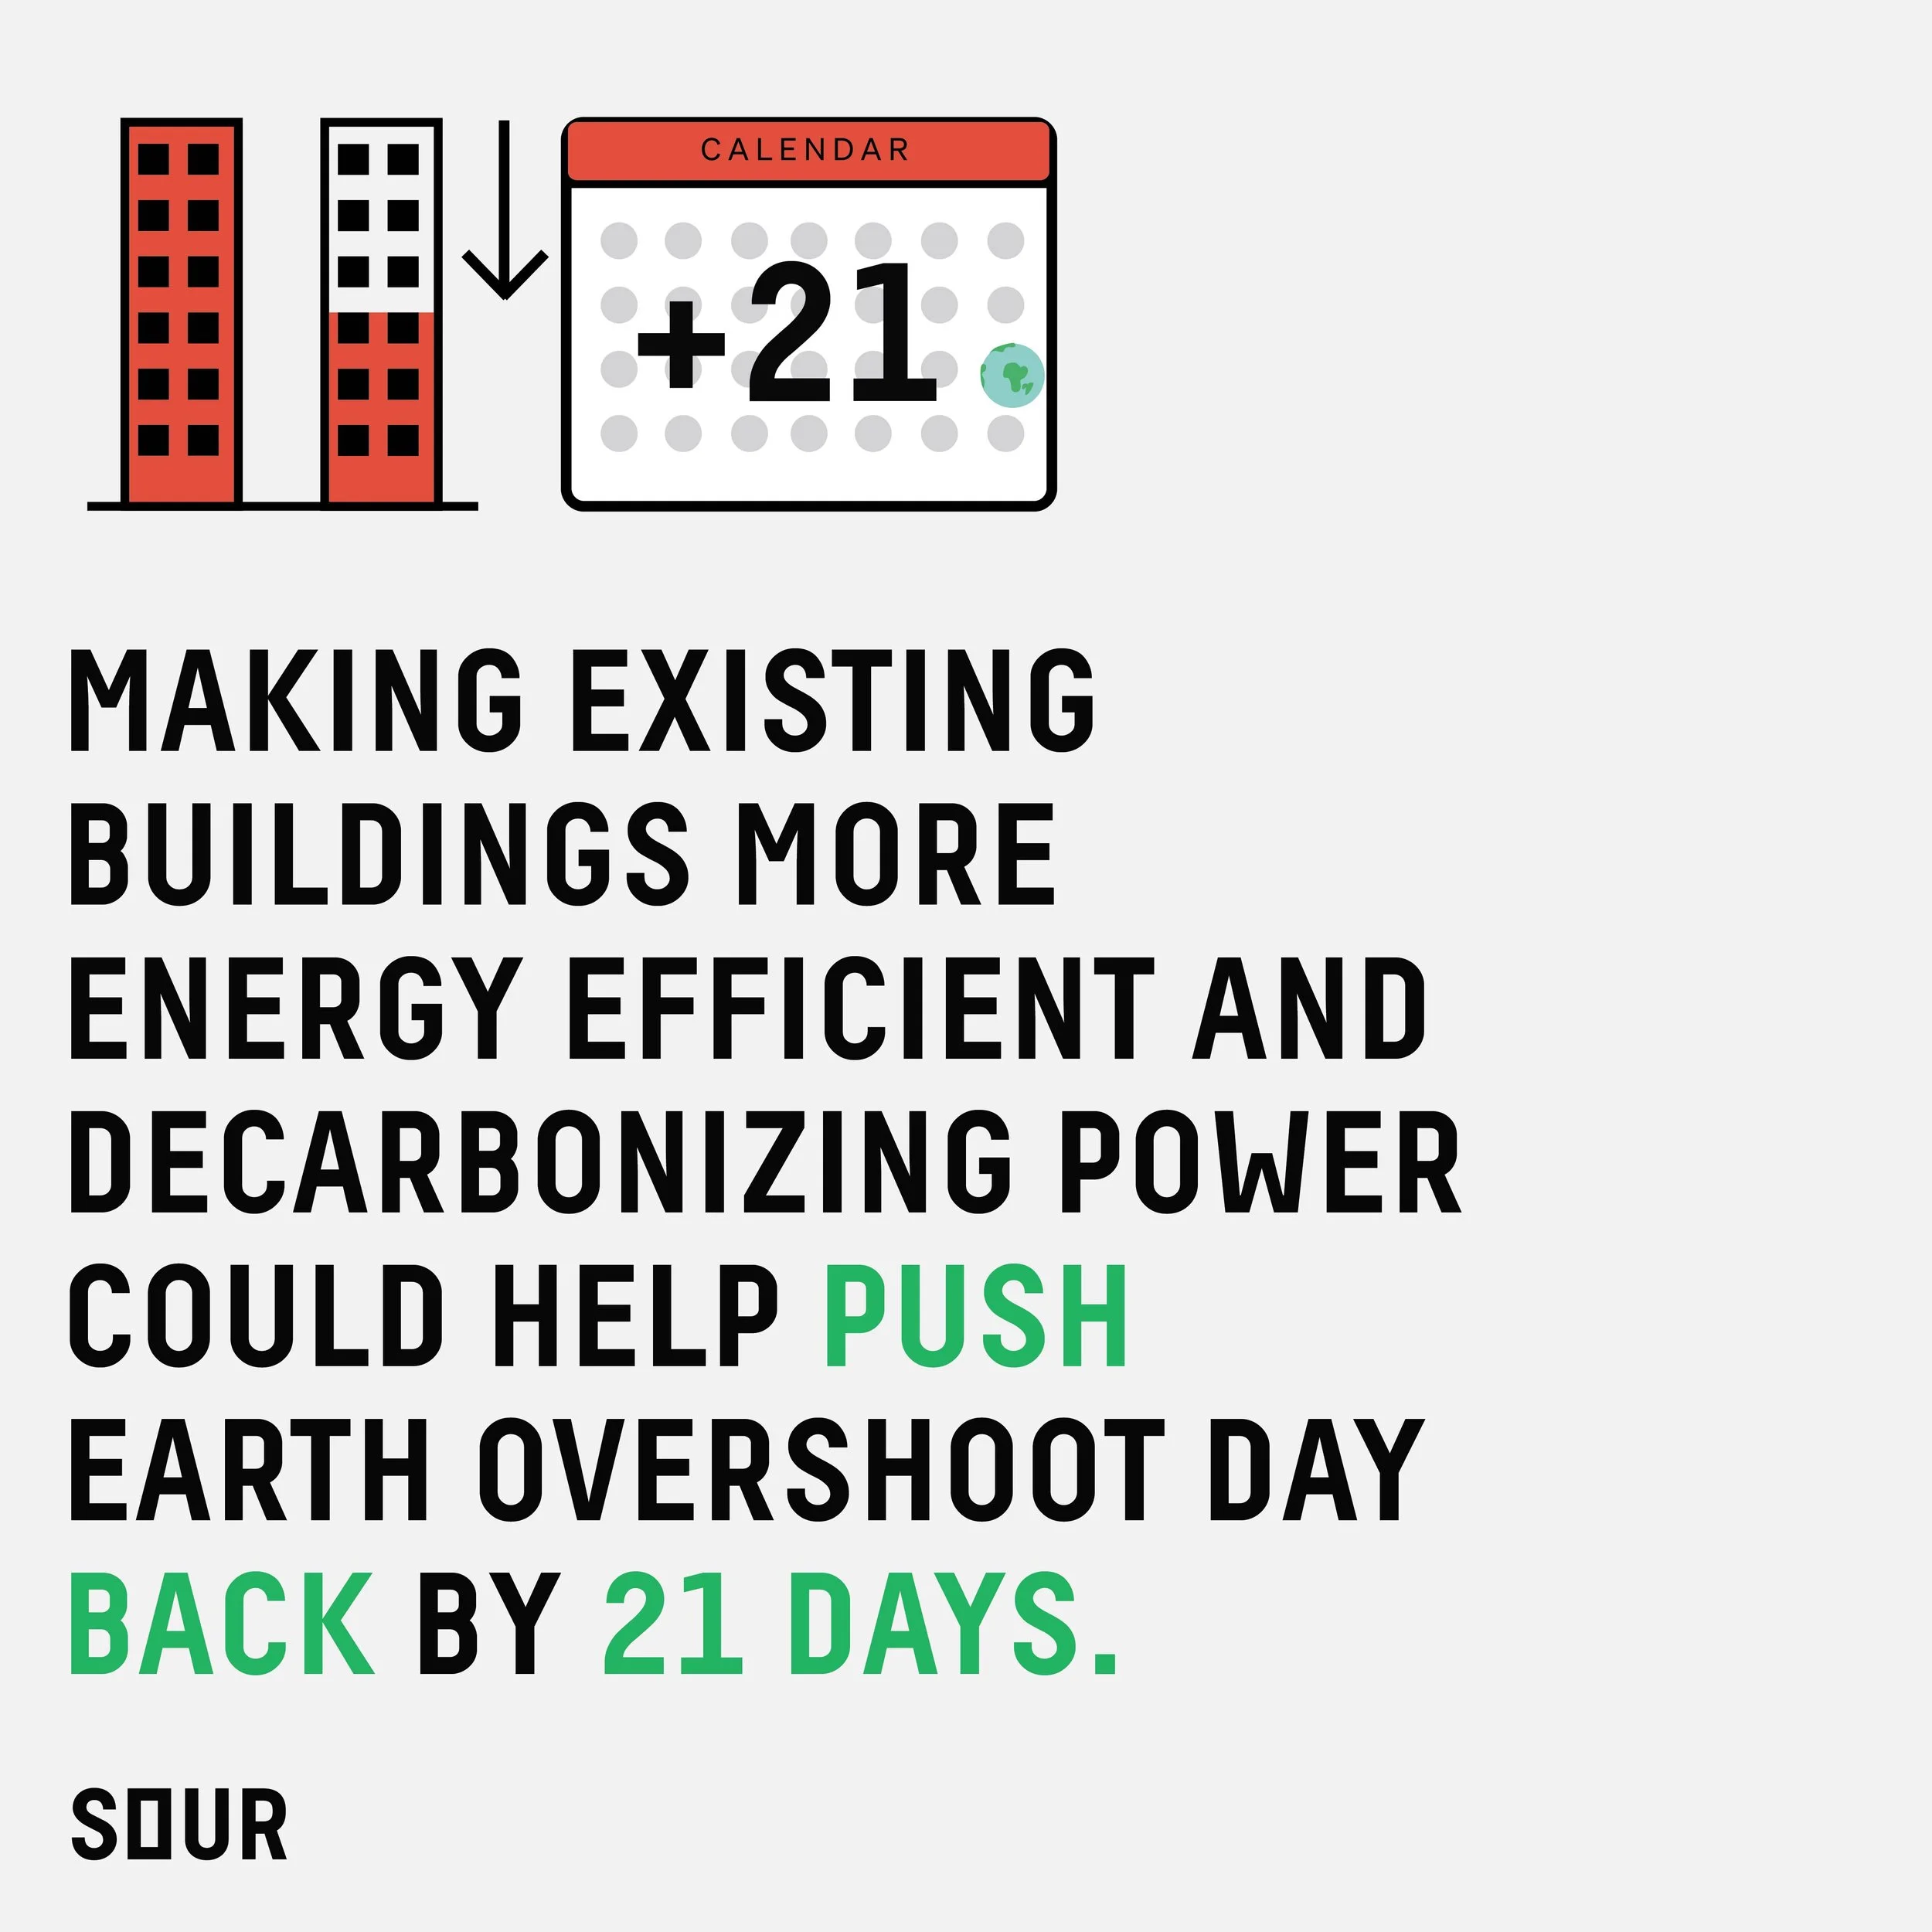
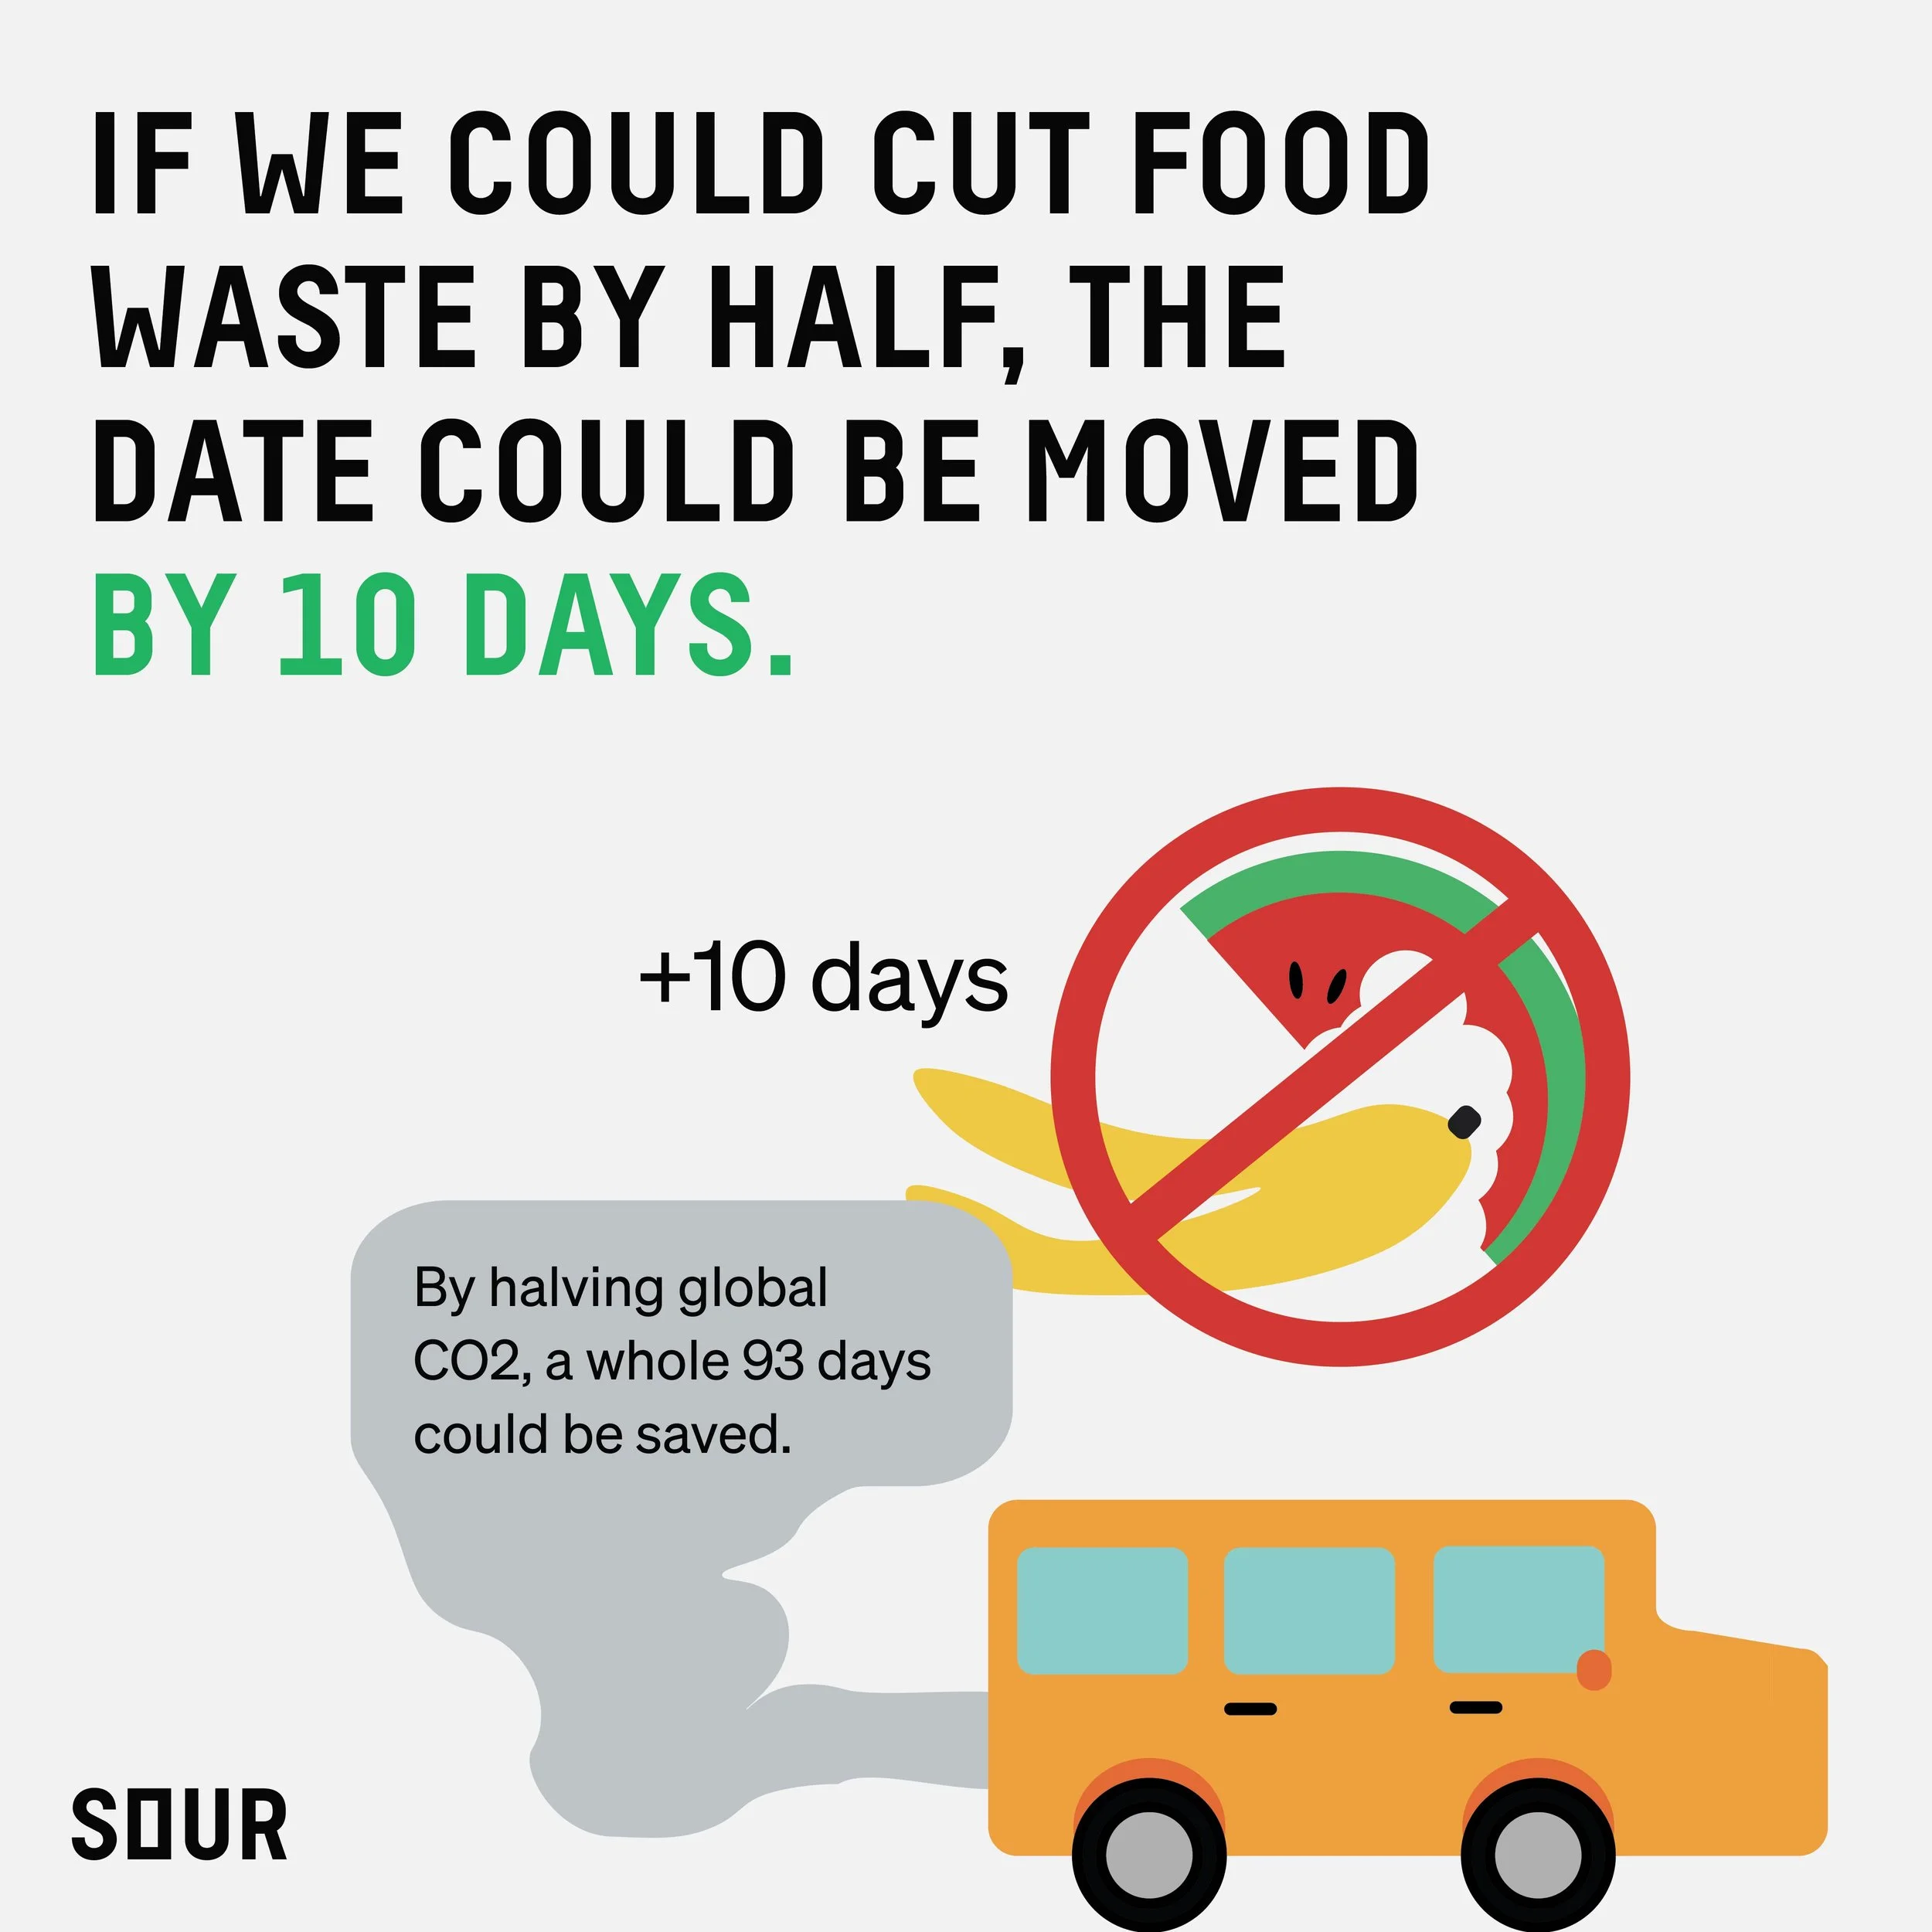
Our goal was to create an engaging and informative infographic that effectively explains the concept of Earth Overshoot Day to a wide audience. This is the date when humanity's demand for natural resources surpasses the Earth's ability to regenerate them within a year.
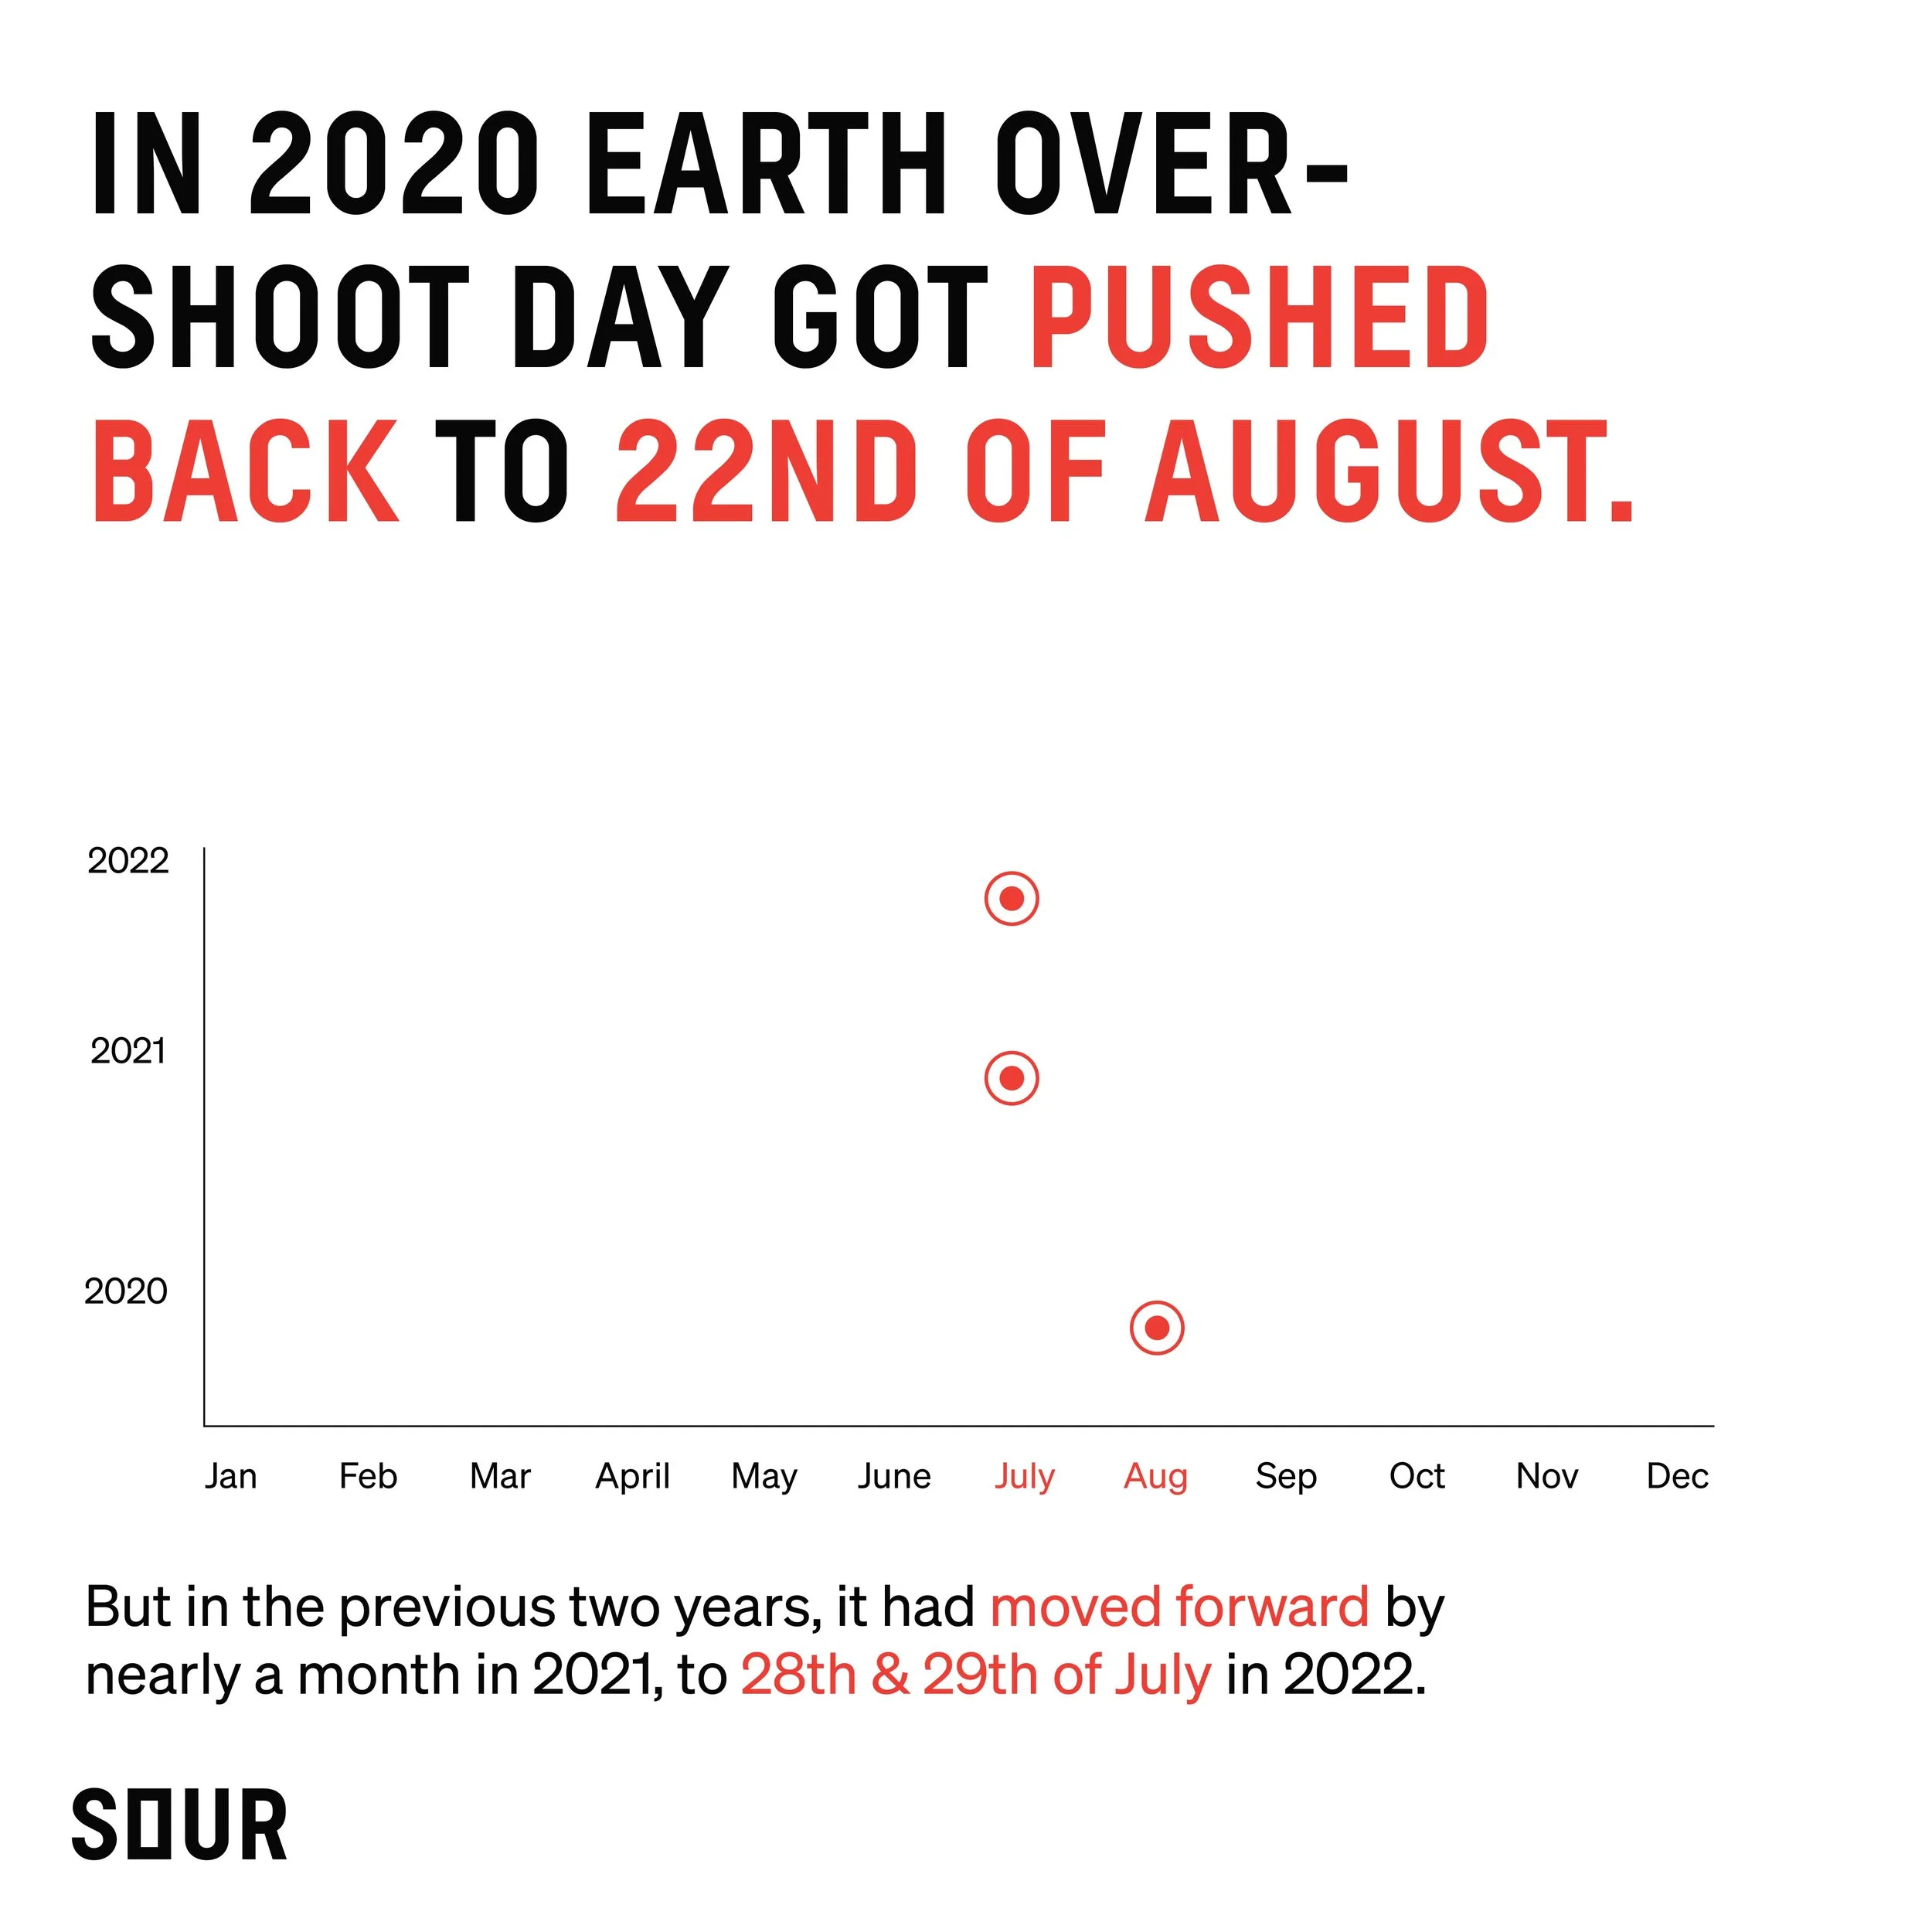
👉🏾 This date changes every year and serves as a crucial sustainability measure, highlighting the ecological strain caused by our consumption patterns.
Solution
This infographic designed for Earth Overshoot Day effectively communicates the concept of this important sustainability metric and its implications. It combines engaging visuals, clear data visualization, and concise yet informative messaging to create a compelling user experience.
💡 The solution focuses on user understanding, engagement, data accuracy, and aesthetic appeal.
Incorporates easily digestible illustrations
Uses straightforward language that is easy to read.
Research:
To create a compelling Earth Overshoot Day infographic, extensive research was conducted, utilizing a variety of authoritative sources such as scholarly research, reports, and real-world examples. Research sources used:
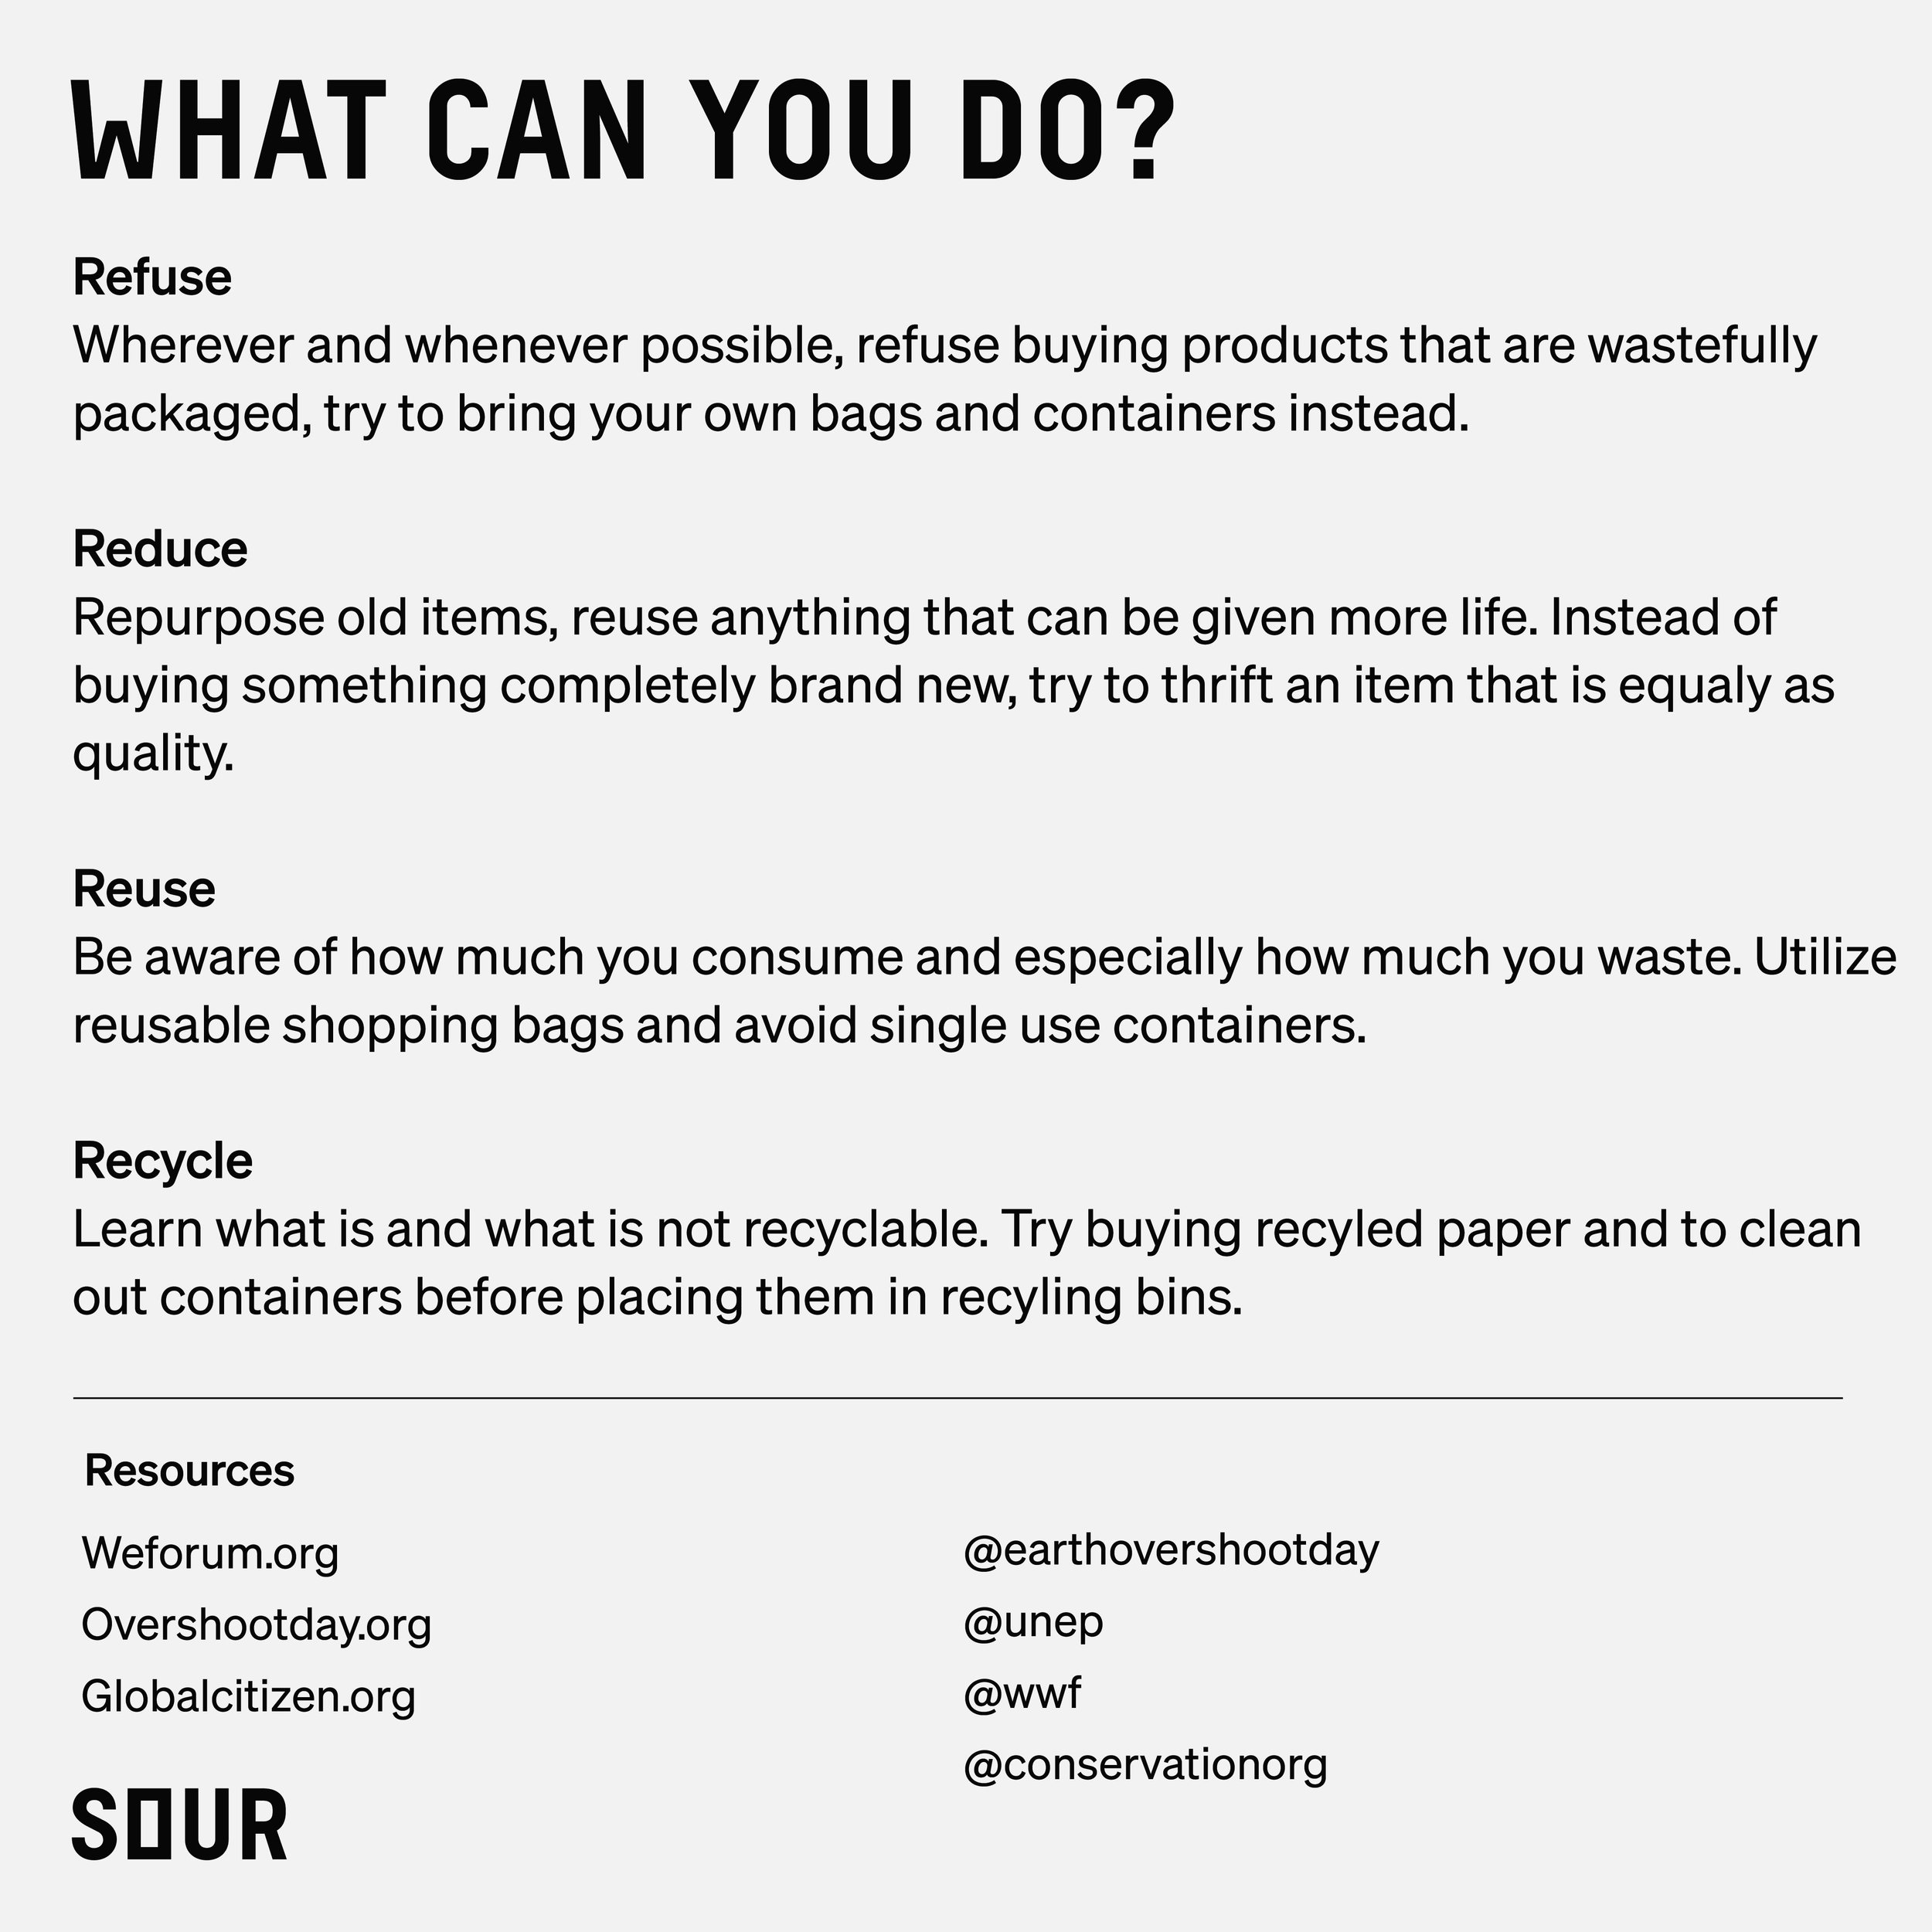
Global Footprint Network (https://overshoot.footprintnetwork.org)
Global Citizen (https://www.globalcitizen.org/en/content/earth-overshoot-day-environment/)
World Economic Forum (https://www.weforum.org/events/annual-meeting-of-the-global-future-councils-2023)
